


Research
Our research team has created an extensive collection of interactive maps and data tools allowing users to explore how policies and investments are impacting communities across the country.
U.S. Department of Energy (DOE) Grant Cuts Database and Map
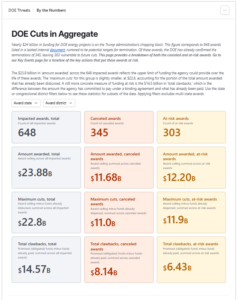 In early October, the U.S. Department of Energy (DOE) terminated 321 awards wiping out $7.5 billion in federal clean energy investments. This followed a wave a terminations in May. A longer list of awards is now rumored to be the target of future cuts. These sweeping cuts are a direct attack by the Trump administration to thwart a transition that’s poised to create good jobs, revitalize communities, and advance climate progress.
This interactive resource shows the real costs of the DOE cuts.
Launched: January 14, 2026
EV Jobs Hub
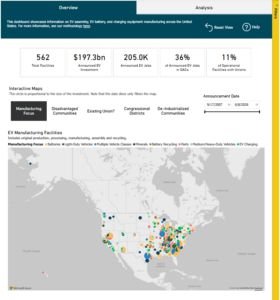 The EV Jobs Hub (EVJH) illuminates not only where new electric vehicle (EV) manufacturing jobs are being announced, but also what those jobs will look like. Are workers currently protected by a collective bargaining agreement? Have employers—particularly those benefiting from significant state and federal subsidies—committed to remaining neutral in the face of union organizing efforts? Are manufacturers working to ensure their facilities support disadvantaged and deindustrialized communities? This hub is an effort to answer those vital questions.
Launched: September 5, 2023
Visualizing the Clean Economy: The Automotive Sector
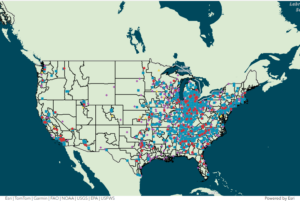 This interactive map and downloadable spreadsheet provide information on manufacturing facilities in the automotive supply chain, including company/facility name, location, evidence of unionization, whether the facility benefits from the 30D Electric Vehicle (EV) Tax Credit, and information on products manufactured. It also includes geographic details, including state, congressional district, coal closure communities, disadvantaged communities, and deindustrialized communities. Details regarding the EV supply chain and relevant federal incentives were cross referenced with data from the EV Jobs Hub maintained by Atlas Public Policy. This updated and improved map was produced by the BlueGreen Alliance Foundation with support from Climate Imperative.
Update Launched: January 22, 2025
Visualizing U.S. Transit and Rail Manufacturing
 This interactive map provides information on U.S. manufacturing facilities involved in the transit supply chain, showing company/facility names, locations, and information about products manufactured and vehicle types. It also includes geographic details, including congressional districts, coal closure communities, disadvantaged communities, and deindustrialized communities.
Update Launched: March 12, 2026
Clean Energy Supply Chain Analysis
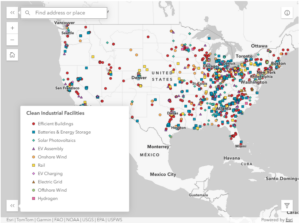 This clean technology supply chain analysis can help federal and state policymakers, advocates, developers, journalists, and others trying to break down the complexity of domestic supply chains for clean energy. The map and spreadsheet show how we can use new investments in the Inflation Reduction Act to bridge supply chain gaps and build a stronger, cleaner, and fairer industrial base for the clean economy in the United States. Instead of hitching our climate goals to exploitative, vulnerable, and polluting production overseas, we have the means to build durable, equitable, top-to-bottom domestic supply chains for our clean energy future.
Launched: May 31, 2023
Solar Supply Chain Map
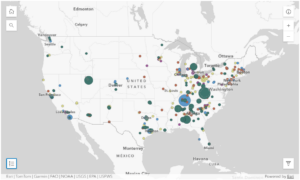 This map shows U.S. facilities manufacturing components for the solar supply chain. Data were compiled by the BlueGreen Alliance. The analysis evaluates domestic manufacturing capacity for each of the main components within the solar supply chain by measuring the domestic supply rate and maps the 335 U.S.-based manufacturing facilities for those components. This resource was developed in partnership with the Rocky Mountain Institute (RMI).
Launched: August 15, 2025
Hard Hit Communities Map
 The BlueGreen Alliance released a visualization of hard-hit areas across the United States that stood to benefit from the investments in the Inflation Reduction Act, Bipartisan Infrastructure Law (BIL), and CHIPS and Science Act. The map highlights communities impacted by the decline of domestic industrial manufacturing, the energy transition, and disproportionate environmental, economic, and health burdens.
Launched: August 3, 2023
Heat Rule Comparison Tool
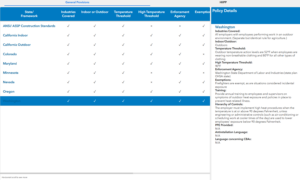
The BlueGreen Alliance, the National Employment Law Project, and Natural Resources Defense Council have designed a Heat Rule Comparison Tool to equip heat rule drafters, worker heat protection advocates, and other stakeholders with practical language solutions to streamline the development of comprehensive heat regulations.